Graphs are constructed using a horizontal scale and a vertical scale, called axes. The horizontal scale is known as the x-axis, and the vertical scale is known as the y-axis. The values on the scale for the x-axis increase from left to right; and for the y-axis from bottom to top.
To plot a point, read along the x-axis then up the y-axis. Point A on the graph is 2 along on the x-axis, and 8 up the y-axis. The location of the point, when given in terms of x and y, are the coordinates of the point, and are shown in brackets with the x-coordinate given first. The coordinate of point A is (2, 8). Similarly, point B has coordinates of (4, 7).
Point C is located on the x-axis. The coordinate for C is (6, 0), which is 6 along and none up.
Additional and Higher: not all coordinates are integers. Point D has coordinates of (4.5, 4.6).
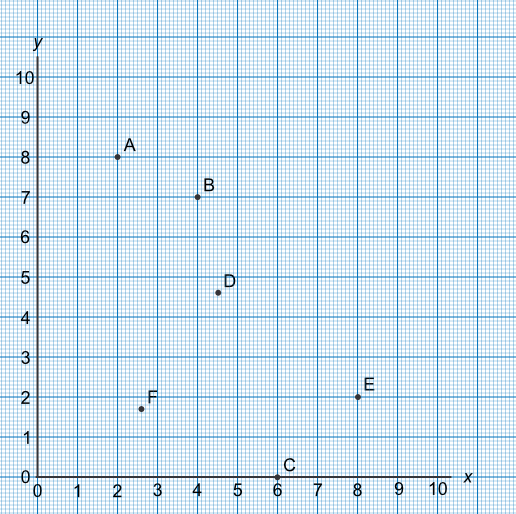
What are the coordinates of point E on the graph, above?
The point is 8 along, and 2 up. The x-coordinate is given first, then the y-coordinate with a comma between them. Both coordinates are put inside brackets.
Answer: (8,2)
What are the coordinates of point F?
Measure 2.6 along the x-axis; then 1.7 up. Use the fainter lines to identify values between the integer numbers.
Answer: (2.6, 1.7)