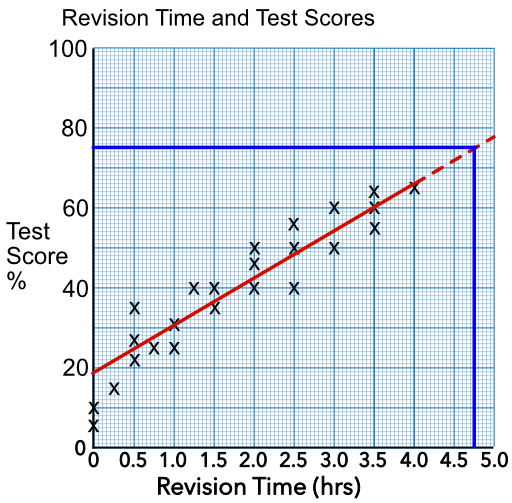
A Line of Best Fit can be drawn through the points on a scatter graph to allow predictions to be made, based on the data.
The line should be drawn to be near to as many points as possible. Note that it must be a straight line. If there are any obvious outliers, then they should be ignored.
The line can then be used to make estimates by reading one value against another. When the estimate is being made between the lowest and highest values, then the data is being interpolated i.e. between known values.

The line can be extended beyond the known set of data to allow further predictions to be made. When an estimate is made outside the range of known data, then the estimate is based on extrapolated data.
Data that has been extrapolated from graphs has to be interpreted with caution.
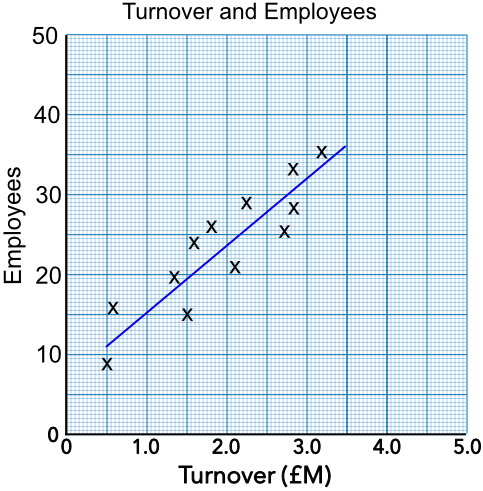
A scatter diagram is shown below, with a best fit line plotted. The scatter diagram shows the turnover (size) of companies in millions of pounds (£M) and the number of employees on an industrial estate. If a company had 25 employees, what would be an estimate for the turnover of the company?
Work along the 25 employees value, then down to read the value from the x-axis.
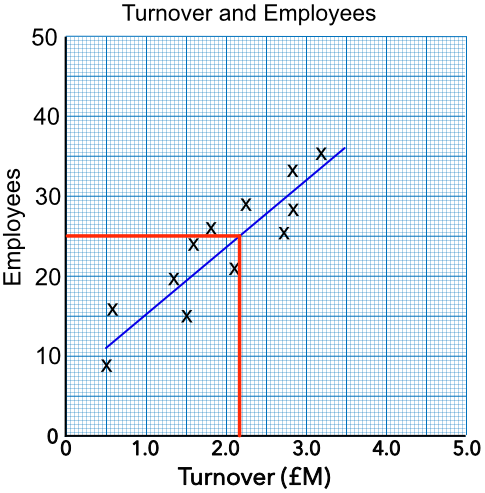
Answer: £2.17M
The scatter diagram shows turnover, in £M (millions of pounds), plotted against the number of employees. How many employees would a company with a turnover of £5M be expected to have, and why could this estimate be inaccurate?
Extend the best fit line.
Read from the bottom scale for £5M up to the extended line, then across for 48 employees.
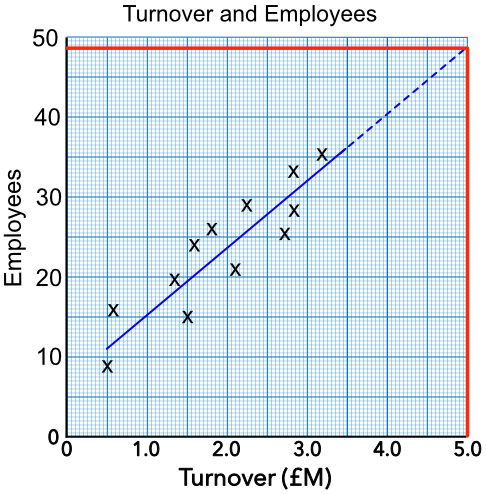
Answer: 48 employees. Because this figure is extrapolated, other factors might come into play eg Employment law, Health and Safety regulations, etc.