A Cumulative Frequency Table is a table with a running total. The frequency for each class interval is added to the previous running total to provide the running total.
A Cumulative Frequency Graph is a plot of these totals. It has the class intervals on the `x`-axis and the running totals (cumulative frequencies) on the `y`-axis. The graph will rise from left to right, with the highest value being the total of all the frequencies.
The first point is plotted plotted with an `x`-value equal to the start value of the ranges and with a `y`-value of 0. Each cumulative frequency is plotted at the right-hand end of each class (i.e., the upper class boundary).
On a cumulative frequency graph, the median can be found by taking the mid-point on the vertical (cumulative frequency) scale. Read along to the line, and drop down to the median value on the horizontal scale.
Similarly, the Lower Quartile can be found by taking a value a quarter way up the vertical scale (i.e. halfway between 0 and the median value). Again, read along to the line, and drop down to obtain the lower quartile value.
The Upper Quartile can be found by taking a point three-quarters of the way up the vertical scale (i.e. halfway between the median value and the maximum). Again, read along from the vertical scale to the line and drop down to obtain the upper quartile value.
The Inter-Quartile Range is a measure of spread, and can be calculated by subtracting the Lower Quartile from the Upper Quartile (the readings on the `x`-axis).
An office used a timecard system to record employees arriving late for work. Plot the data onto a cumulative frequency graph.
| Late (mins) | Frequency |
| 0 < m ≤ 4 | 8 |
| 4 < m ≤ 8 | 9 |
| 8 < m ≤ 12 | 6 |
| 12 < m ≤ 16 | 5 |
| 16 < m ≤ 20 | 4 |
| 20 < m ≤ 24 | 3 |
| 24 < m ≤ 28 | 1 |
| Late (mins) | Frequency | Cumulative Frequency |
| 0 < m ≤ 4 | 8 | 8 |
| 4 < m ≤ 8 | 9 | 8 + 9 = 17 |
| 8 < m ≤ 12 | 6 | 17 + 6 = 23 |
| 12 < m ≤ 16 | 5 | 23 + 5 = 28 |
| 16 < m ≤ 20 | 4 | 28 + 4 = 32 |
| 20 < m ≤ 24 | 3 | 32 + 3 = 35 |
| 24 < m ≤ 28 | 1 | 25 + 1 = 36 |
Plot the points (0, 0), (4, 8), (8, 17), (12, 23), (16, 28), (20, 32), (24, 35), (28, 36)
Answer: 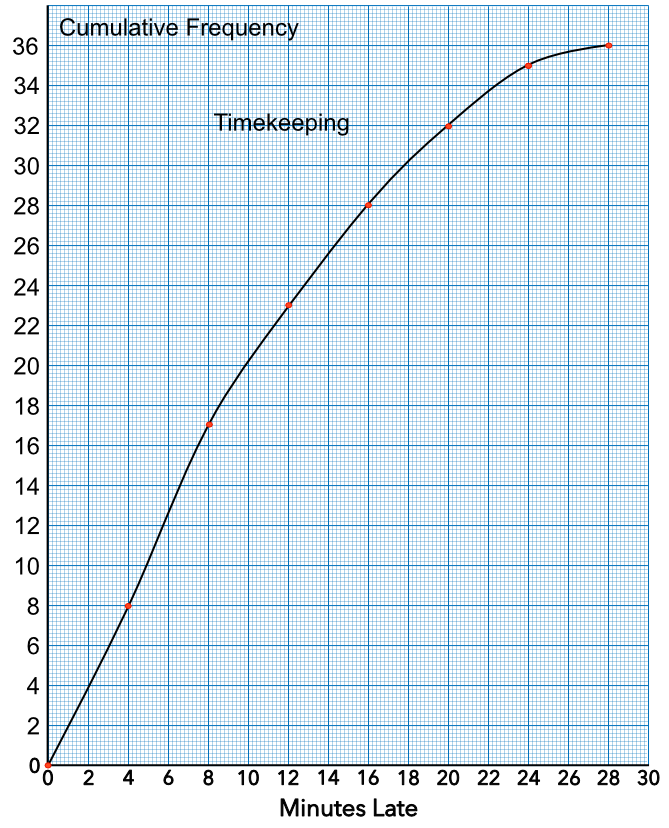
Given the Cumulative Frequency graph from above, give an estimate for the median lateness.
The median is the middle value, which is 18 people. Read across from 18 people on the cumulate frequency scale to the line. Drop vertically to estimate the time late.
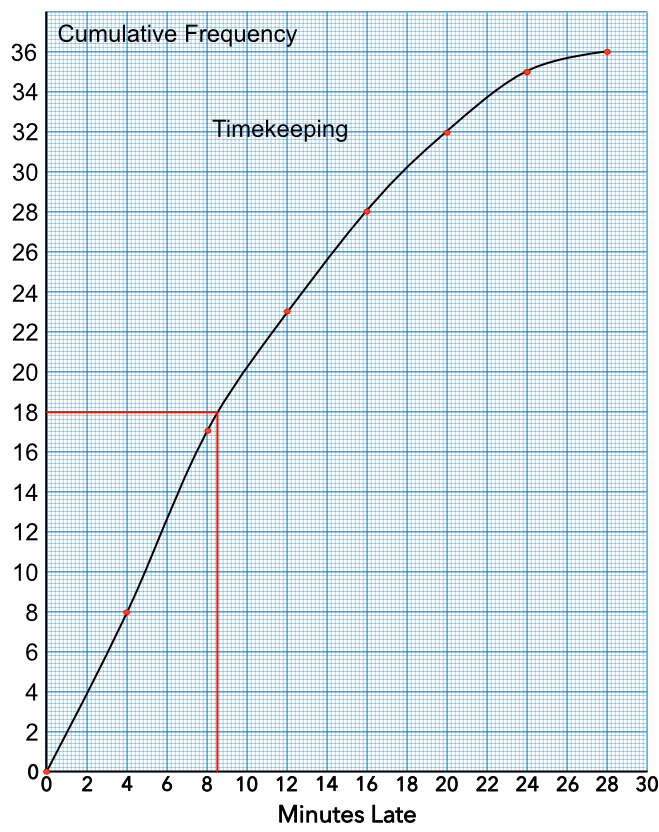
Answer: 8.6 minutes