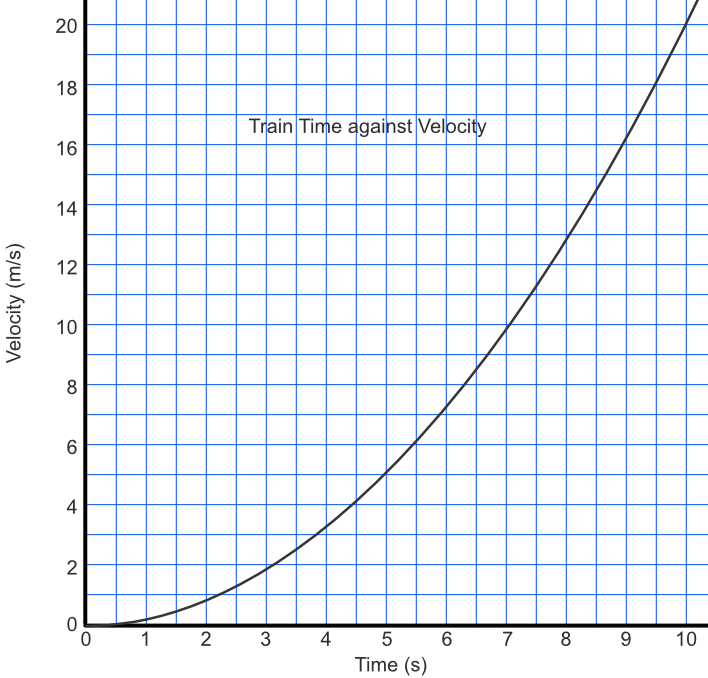
When a graph shows velocity against time, the area under the graph between two points gives the distance travelled. An estimate of the area under the curve can be obtained by drawing a #chord# between the two points to obtain a trapezium (or, in some cases, a triangle).
A train accelerates away from a station as shown on the graph. After 5 seconds, the velocity of the train is 5.1m s-1. Estimate the distance covered by the train.
The approximate area under a graph is given by the triangle between seconds = 0 and seconds = 5. The area is given by `frac(1)(2) xx 5 xx 5.1 = 12.75`m.
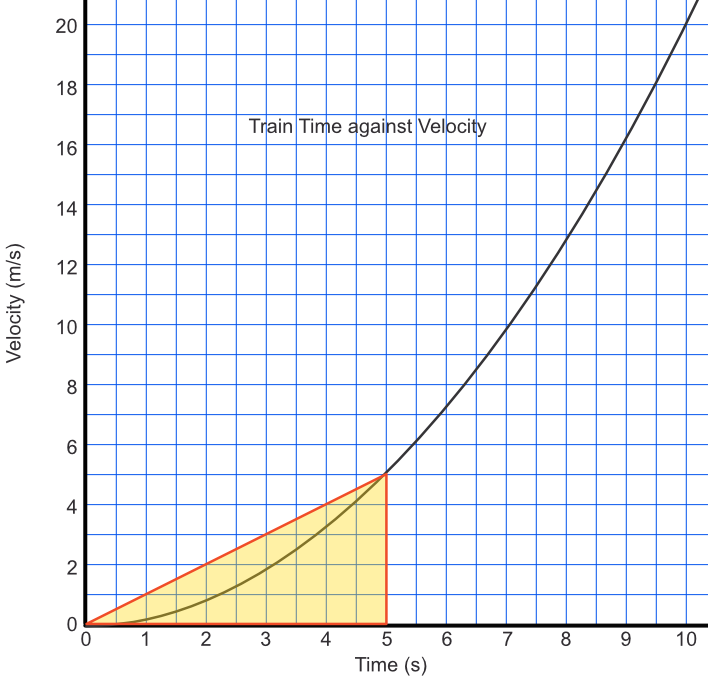
Answer: 12.75m
How could you improve the estimate of the answer, above?
If the speed at 2.5 seconds is 1.2ms-1, then the approximate area under the graph is given by `frac(1)(2) xx 1.2 xx 2.5 + frac(1)(2) xx (1.2 + 5.1) xx 2.5`
`=1.5 + 7.75` `= 9.25`
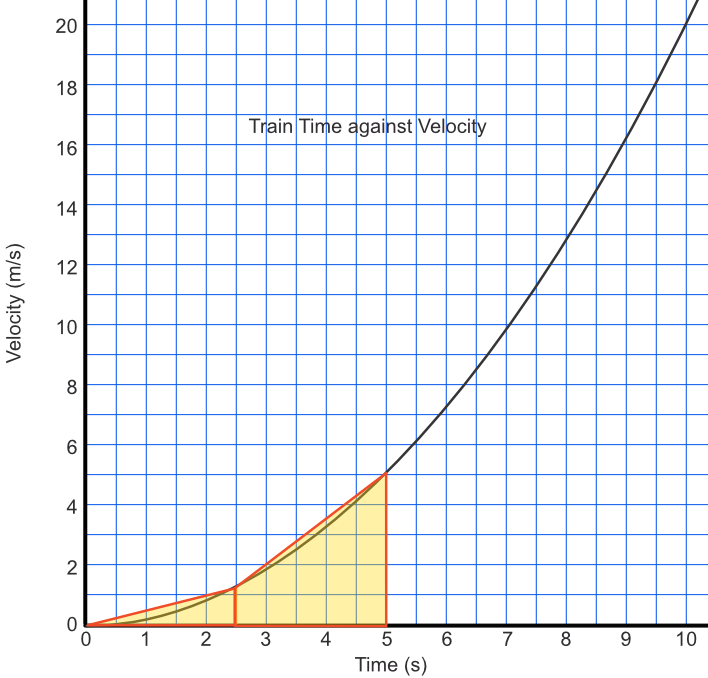
Answer: By taking an intermediate point and working out the area under the start to the intermediate point, and the area under the intermediate point to 5 seconds.
See also Area of a Trapezium and Speed