A Frequency Table is used to show totals for different values: for example, the number of shoes for different sizes of shoes.
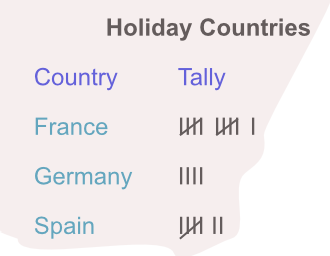
Frequency tables are often built from a Tally Chart, or Data Collection sheet, which use an individual mark for each item. Add a mark for each of the first four items and put a diagonal line through for the fifth item. The tallies are then in groups of five.
Frequency Tables can be created for distinct items (such as shoe sizes). Where the items can only be of particular values, the data is called Discrete Data.
Measured data (such as the height of students) is known as Continuous Data. When using grouped or range data, the ranges or groups must not overlap.
Frequency tables may also show grouped items (such as the ages of people in a survey) into a Grouped Frequency Table . A range or group will be shown as an inequality: for example, `18< text(age) ≤21` includes all people older than 18 and less than or equal to 21. One of the inequalities will include an equals value; the other inequality will not.
A survey of the marks for a class taking a test are shown below. Create a Frequency Table to show the results using ranges of 40≤ m<49, 50≤ m<59, 60≤m<69 and 70≤m<79.
42, 75, 65, 54, 42, 43, 53, 51, 62, 65, 67, 63, 42, 51, 42, 43, 58, 49, 62, 44, 46, 44, 57, 61, 62
Answer:
| Score | Frequency |
| 40 ≤ m < 49 | 8 |
| 50 ≤ m < 59 | 6 |
| 60 ≤ m < 69 | 8 |
| 70 ≤ m < 79 | 1 |
A survey was taken about car sharing into a particular office. The number of people in each car was noted on a frequency table. Does the survey report Continuous or Discrete data?
You can count the number of people as distinct individuals; and you cannot have part of a person. This makes the data discrete.
Answer: Discrete