Pythagoras Theorem states that the sum of the square of the two shorter sides is equal to the square of the hypotenuse:
`a^2 + b^2 = c^2`
where a and b are the two shorter sides, and c is the long side.
Replace the a and b with x and y coordinates. Setting `x^2 + y^2 = r^2`, and keeping r constant, describes a circle of radius r with a centre at the origin.
A function is defined as `x^2 + y^2 = 64`. Construct the graph.
The radius of the circle is `sqrt64`. The centre of the circle is at 0,0, with radius 8.
Answer: 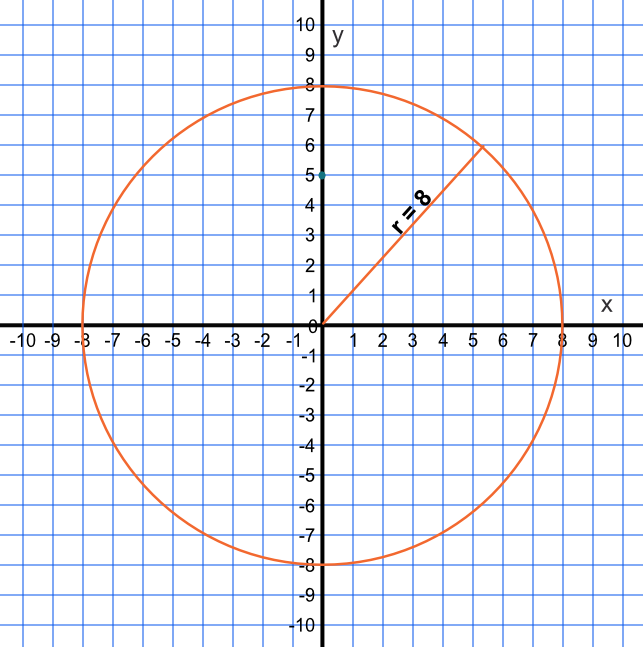
A function is defined as `x^2 + y^2 = 50`. Is the coordinate (4, 3) within the circle?
Work out the value of `4^2 + 3^2` = 25. This is less than 50, so the coordinate is within the circle.
Answer: Yes
See also Pythagoras and Circumference of a Circle