Sketches of graphs can give the solutions to quadratic equations. Solutions to equations are given where the line crosses y = 0. Note that reading from a graph may only give an approximate answer. If the line does not cross y = 0, there are no solutions. If the line only touches y = 0, then there is only one solution.
Check any answer obtained from a graph by substituting the values from x into the equation and confirm that they equal, or approximate to, zero.
Using the graph below, determine the solutions, if any, of the equation x2 - 4x + 8 = 0.
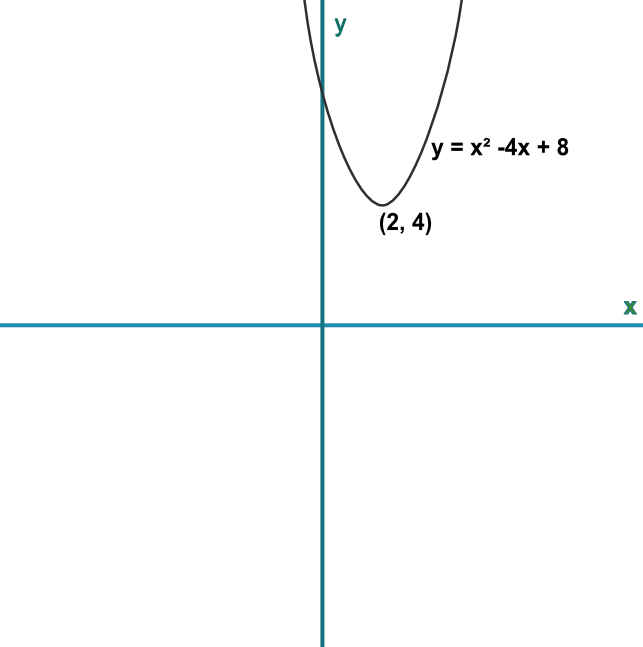
Because the line does not cut the x-axis, there are no solutions.
Answer: There are no solutions to the equation.
A graph has been sketched, below. Prove that the sketch is inaccurate.
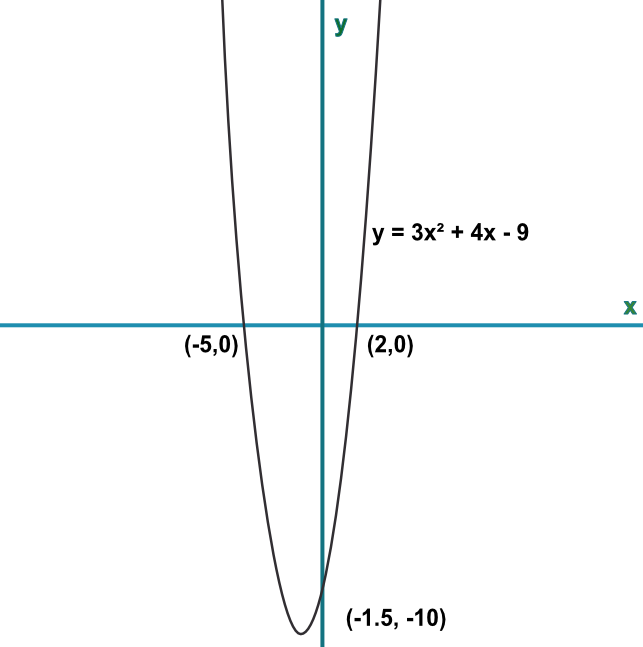
Take the `x`-value of any coordinate and substitute into the formula. You should obtain the `y`-value for that coordinate
For `x=2, y=3(2)^2+4x-9=7` and it should be 0
For `x=-1.5, y = 3(-1.5)^2+4(-1.5)-9=-12.75`, it should be -10
For `x=-5, y=3(-5)^2+4(-5)-9=45`, it should be 0
Answer: Substitute the value for one of the roots into the function eg 2: 3(2)2 + 4(2) - 9 = 11
This value should equal, or be very close to, zero and it is not.
The other root and the turning point could also be used to prove the graph is in error.
See also Roots and Using the Quadratic Formula