Rates of Change may be determined graphically, using a tangent to a graph; or numerically by using data to determine the gradient.
Drawing a tangent to a graph will give an instantaneous rate of change whereas using data for two points (which would be the same as drawing a chord on the graph) will give an average rate of change.
A racing car accelerates from stationary and covers 260m in the first six seconds. In the following six seconds, it covers a further 460m. What is the average velocity of the car over the first 12 seconds?
Total distance covered is 260 + 460 = 720m
Total time = 12 seconds
Average velocity = `frac(text(distance))(text(time))` = 720 ÷ 12 = 60m/s
Answer: 60m/s
The graph shows distance against time for a train pulling away from a station. What is the speed of the locomotive at 6 seconds?
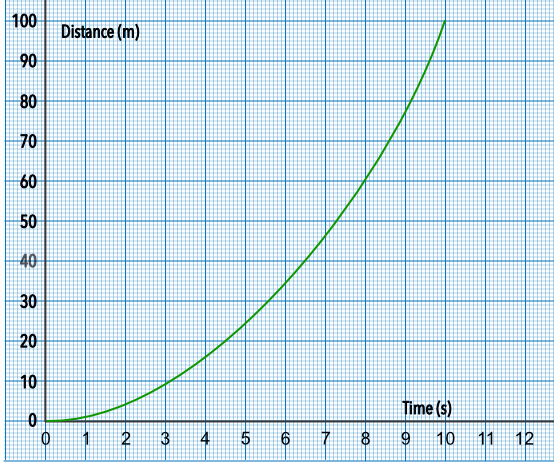
Draw a tangent to the graph at 6 seconds.
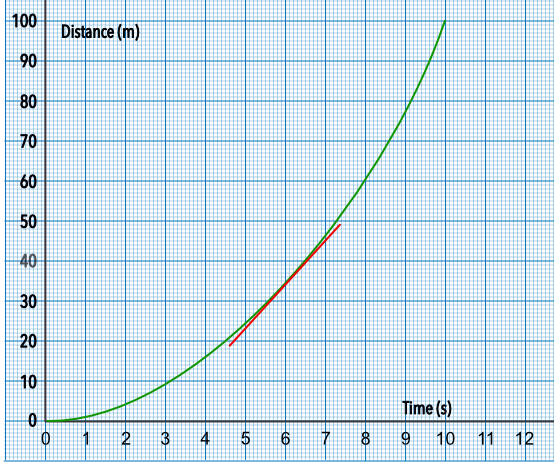
The gradient of the tangent gives the velocity.
gradient = `frac(text(up))(text(along))` = `frac(45 - 23)(7 - 5)` = `frac(22)(2)` = 11 m/s
Answer: 11 m/s