A Vertical Line Chart is used to show ungrouped discrete data.
The data is similar to a bar chart, but the vertical line has no width.
The chart shows that the data is discrete (the lines do not touch each other) and that they are ungrouped (there is no width to the vertical line).
A vertical line graph shows the results of a test for Year 10.
What was the modal score?
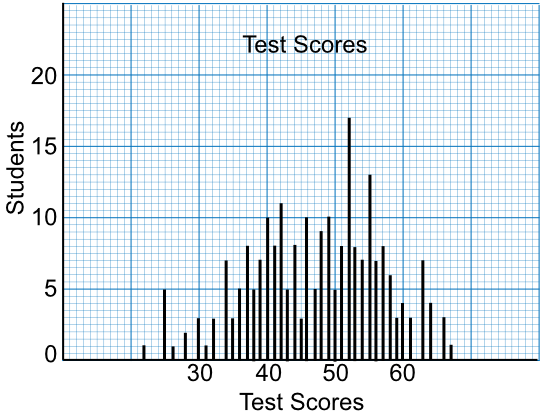
The highest bar gives the most frequently obtained score. 17 students achieved a score of 52.
Answer: 52
A vertical line graph shows the results of a test for Year 10.
What was the range of marks on the test?
Use the Vertical line graph, above.
The lowest score obtained was 22. The highest score obtained was 67. The range of marks is 67 - 22 = 45
Answer: 45
See also Mode and Spread of Data