An exponential function is of the form `n^x`, where n is a positive number, and which has been raised to a power. If the value of the function increases as `x` increases, then this is known as exponential growth. If the value of the function decreases as `x` increases, then this exponential decay.
Draw the graph of `y= 2 x 3^x` for -4 ≤ `x` ≤ 4.
| `x` | -4 | -3 | -2 | -1 | 0 | 1 | 2 | 3 | 4 |
| `0.5xx2^x` | 0.03 | 0.06 | 0.1 | 0.2 | 0.5 | 1 | 2 | 4 | 8 |
Answer: 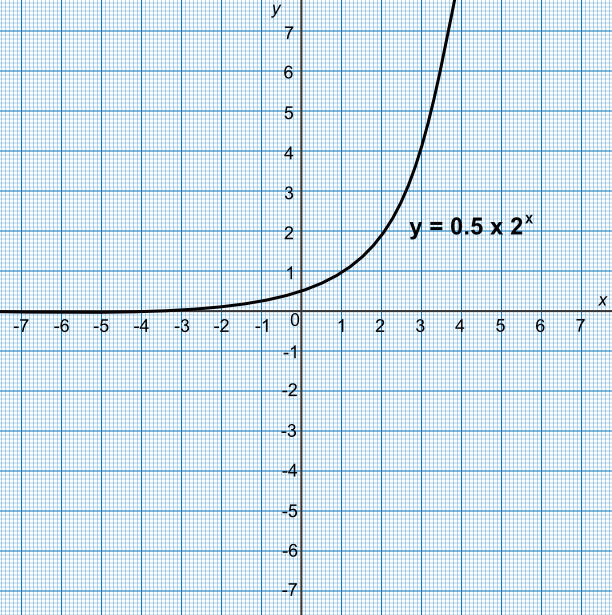
Radium-192 has a half-life of about 70 days. Using the table below, plot the graph of the number of emissions per second, and using the graph estimate the number of emissions after 100 days.
| Time (days) | 0 | 70 | 140 | 210 | 280 | 350 |
| Count /second | 1000 | 500 | 250 | 125 | 63 | 31 |
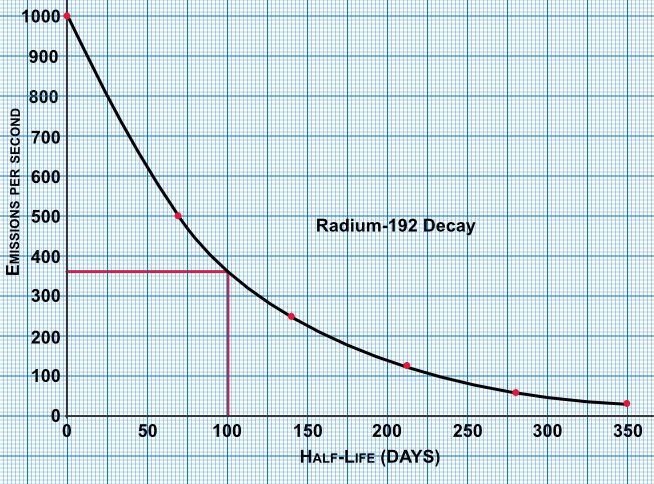
Answer: 370
See also Growth and Decay