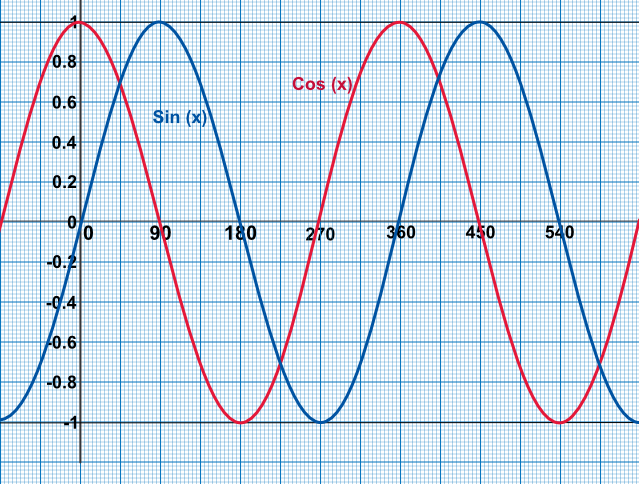
The values of sin(`x`) and cos(`x`) are shown below. Note that sin(`x`) and cos(`x`) repeat every 360º. To read the sin or cos of an angle, read up from the `x`-axis to the function.
To read the inverse, read from the `y`-axis along to the line. Note that you can then read along to the next line of the function. For example, sin-1(0.5) has answers of 30º or 390º, or even -210º. In other words, there are several answers for a single value.
Because the values repeat, exam questions will limit the angles being examined by terms such as solve for `0º < x < 360º`.
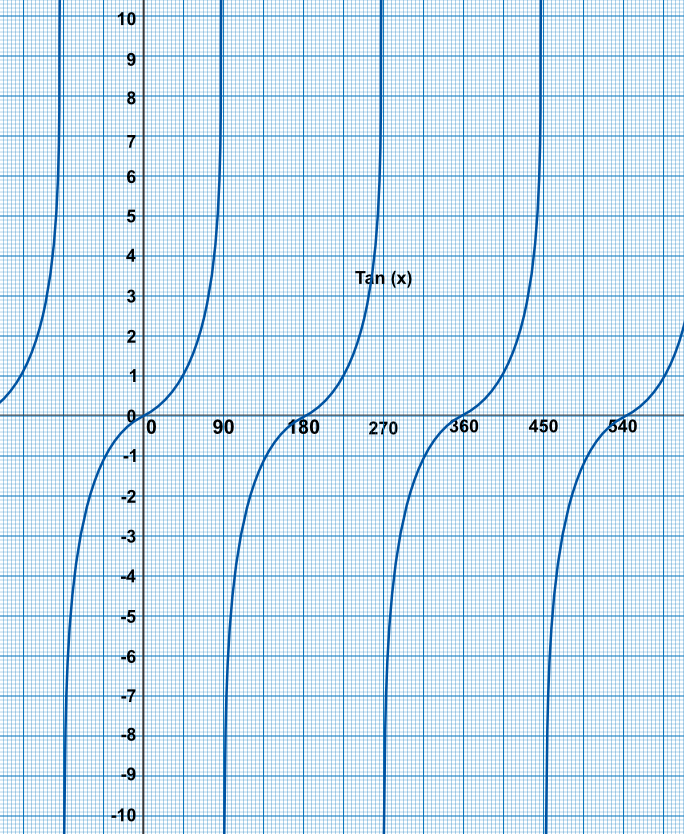
Tan(`x`) repeats every 180º.
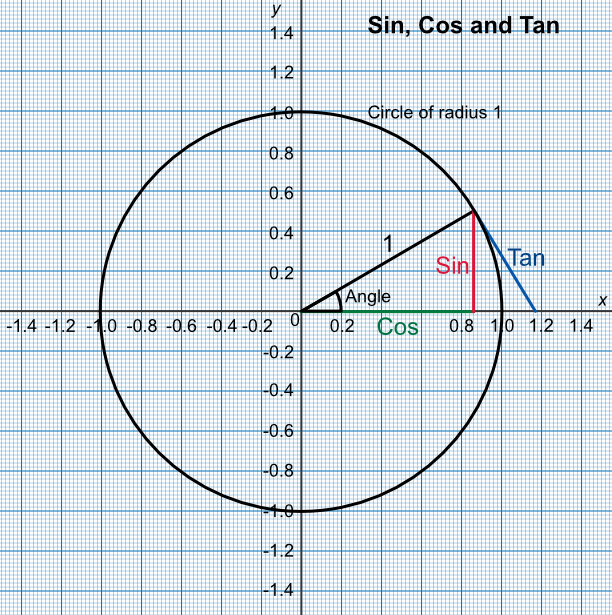
The graphs can be derived by examining a circle of radius 1. The sin value for an angle can be obtained by reading from the vertical axis. The cos value can be obtained by reading from the horizontal axis.
Using a graph showing the sin function, determine the value of sin(180º).
Read along the `x`-axis until you read 180º. At this point the sin graph crosses the `x`-axis.
Answer: 0
Give three angles where cos(`x`) is equal to 0.8 for -90 < `x` ≤ 360º.
The question asked for all instances of cos(`x`) = 0.8 between -90º and 360º. There rae three instances - see graph above.
Answer: -37º, 37º, 323º
See also Sin and Values of Significant Angles