Scales are used to indicate values on graphs. The distance between successive values must be regular.
Check the scale to see by what value the scale is increasing: it may go up in 1s, 2s, 5s, 10s or some other increment. Use the lighter lines to determine intermediate values.
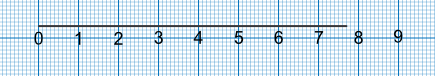
The example below shows a scale which increases in single values. The line stops between 7 and 8. It is seven faint lines after the value of 7 which gives it a value of 7 + 0.7 = 7.7.
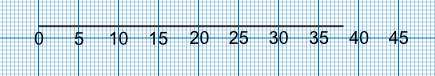
The next example shows the scale going up in increments of 5. The line is 6 faint lines past the value of 35. Each of the 2 faint lines is worth 1, so 6 lines is worth 3. The value of the line is 35 + 3 = 38.
What is wrong with this scale?
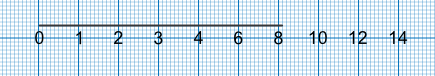
The scale increases with a value of 1 until it reaches 8, then it increases with a value of 2. The scale is not consistent.
Answer: The scale is not consistent.
What is the value of the line?
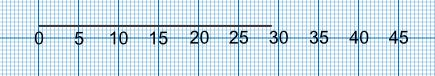
The scale increases in 5s, each set of 2 lines is worth 1. It is 2 lines short of 30, therefore 29.
Answer: 29