To plot a straight line, create a small table.
Determine at least three values of `x` to plot, and work out the values of `y` by substituting for each value of `x`. This will give you coordinates for these points.
Plot the points, and draw a straight line through the three points, extending the graph beyond the two outside points.
By calculating three points, you will catch any arithmetical errors when you were calculating the values of `y`. If a straight line cannot be drawn through these points, check the calculations.
An equation is given by `y = 3x - 4`.
What are the coordinates that would be plotted for `x` = -2, `x` = 0 and `x` = 3?
when `x` = -2 then `y = 3 xx (-2) - 4 = -10`
when `x` = 0 then `y = 3 xx (0) - 4 = -4`
when `x` = 3 then `y = 3 xx (3) - 4 = 5`
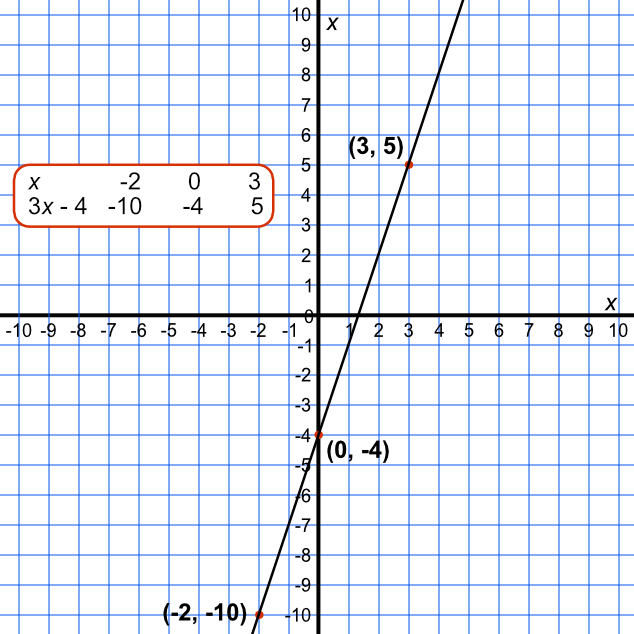
| `x` | -2 | 0 | 3 |
| `3x - 4` | -10 | -4 | 5 |
Answer: (-2, -10), (0, -4) and (3, 5)
Plot the graph for `y = 3x - 4`.
Answer: