An exponential graph is generated from a function of the form `f(x)=m^x`.
The graph will be curved. They will typically show compound interest or compound growth. Because the graph is curved, use several points to plot the graph. In real-life situations, the graph normally shows positive values. In algebraic usage, the negative parts of a graph would also be shown.
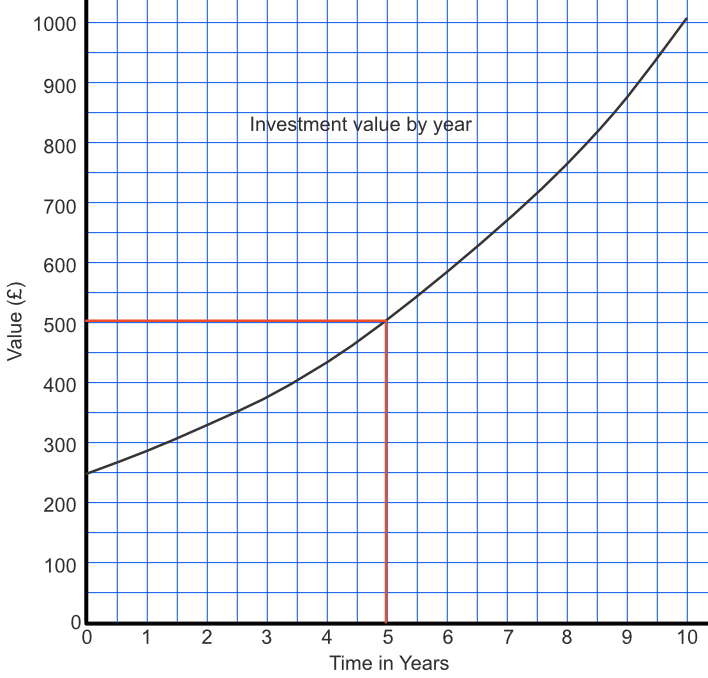
£250 is invested with a compound rate of 15%. The table below shows how the saving grows over 10 years. Plot the graph, and determine what the investment is worth after 5 years.
| Time (years) | 0 | 2 | 4 | 6 | 8 | 10 |
| Value (£) | 250 | 330 | 437 | 578 | 765 | 1011 |
After 5 years, £503 (any answer around £500 would be accepted). Draw up from 65 years to meet the graph, then along to read the value from the vertical scale.
Answer: £503
From the graph, above, estimate to the nearest year how long would it take before the value of the investment is worth £800.
Read along from £800 to meet the graph, then down for a value of 8.3 years, or 8 years to the nearest year.
Answer: 8 years
See also Graphing Exponential Functions