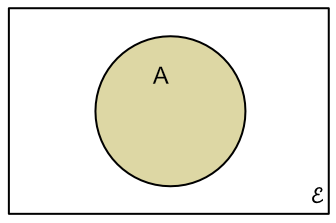
Probability events can be allocated to sets. The sets can then be analysed by using Set Theory or Venn Diagrams.
The universal set consists of all possible events.
For a given outcome, all the events that are possible for that outcome will belong to the same set.
The probability of a given outcome is:
P(outcome) = `frac(text(number of members of set))(text(number of members in universal set))`
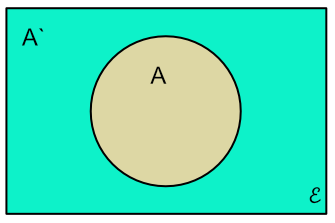
The probability of an event A not happening is P(not A). In set terms, this is shown as
P(A`),
and P(A) + P(A`) = 1.
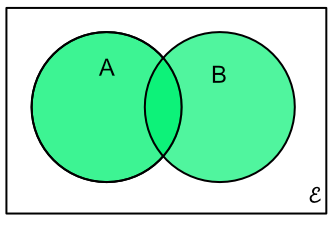
When a probability can be an outcome in A AND B (A #intersection# B, or `A nn B`) then the overlap of sets A and B are considered.

When a probability is being considered where an event can be in either outcome A OR B then all the elements in A and B are considered (elements in A #union# B, or `A uu B`: note that elements in both A and B are counted only once.
Two fair dice are thrown. Using a Venn Diagram, what is the probability of `O uu P` where O is the set of odd numbers and P is the set of Prime numbers?
| `epsilon` | = {2, 3, 4, 5, 6, 7, 8, 9, 10, 11, 12} |
| `text(O)` | = {3, 5, 7, 9, 11} |
| `text(P)` | = {2, 3, 5, 7, 11} |
| `O uu P` | = {2, 3, 5, 7, 9, 11} |
Number of events = 11
P(`O uu P`) = `frac(6)(11)`
Answer: `frac(6)(11)`

With the Venn Diagram, above, what is the probability of `O nn P`?
`O nn P = {3, 5, 7, 11}` = 4 events
`epsilon` is 11 events
P`(O nn P) = frac(4)(11)`
Answer: `frac(4)(11)`
See also Exhaustive Outcomes and Mutually Exclusive Events