A quadratic function will contain a squared term, but will have no higher power. Plotted on a graph, it will be in the shape of a parabola, which is a curve that comes to a rounded point then turns to curve back again.
The point at which it turns is a turning point, and this will be either a minimum or a maximum value. Curves can fall, turn, and rise again; or they may rise, peak, and fall.
Draw graphs as accurately to obtain any turning points or roots.
Plot the graph `y = x^2 - 3`.
The graph y = x2 - 3 may be plotted using the following points:
| `x` | -4 | -3 | -2 | -1 | 0 | 1 | 2 | 3 | 4 |
| `x^2 - 3` | 13 | 6 | 1 | -2 | -3 | -2 | 1 | 6 | 13 |
Answer:
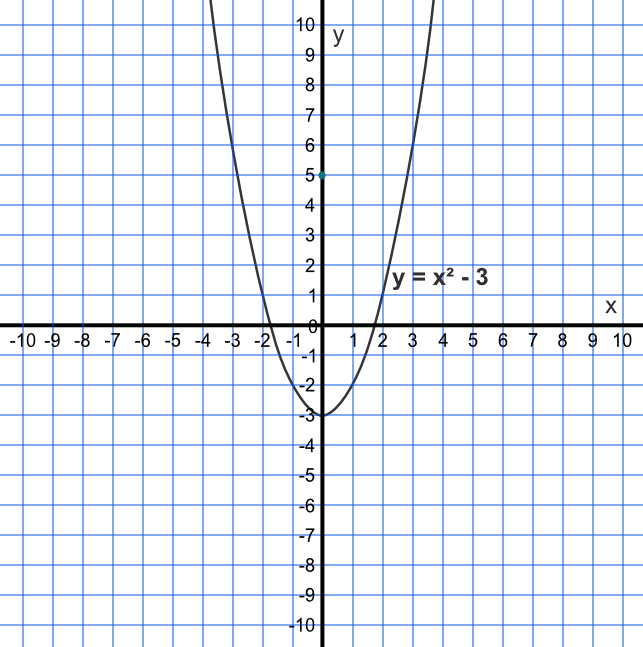
For the graph, above: is the turning point a minimum value or a maximum value?
The point at which the graph turns is the lowest point for the line. It is therefore a minimum point.
Answer: Minimum