Inequalities may also be represented in quadratic form. To represent an inequality in quadratic form, plot the graph for the equation equivalent of the quadratic, then determine which side of the line the inequality applies to. Given the nature of a quadratic, this will be either inside or outside the loop.
As with all inequalities, the inequality itself may be less than, less than or equal to, greater than, or greater than or equal to.
A quadratic inequality and a linear inequality are often linked together, giving a bounded area.
The graph below shows an inequality `y > -x^2 + 5`. Indicate which point satisfies the inequality.
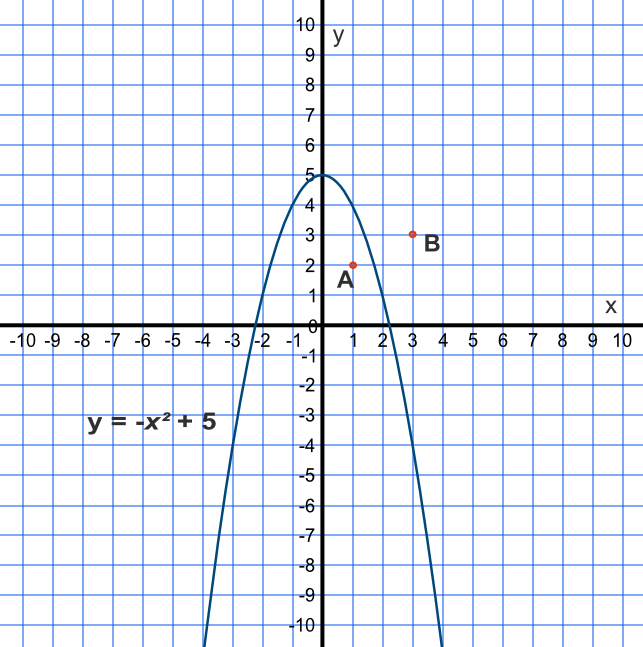
Substitute the coordinates for point A into the inequality: `2 > -(1)^2 + 5` is 2 > 4 which is false. So point A does not satisfy the inequality.
Point B must be true, but check to confirm: `3 > -(3)^2 + 5` is 3 > -4 which is true. Point B does satisfy the inequality.
Answer: Point B
By drawing a graph, or otherwise, give the number of integer co-ordinates satisfied by the inequalities `y > x^2 - 4 text( and ) y < x + 1`.
Draw a graph for `y = x^2 - 4` and `y = x + 1`. Note that neither inequality is or equal to so both lines are dotted.
Choose a point bounded by both lines to ensure that the area satisfies both inequalities.
Point (1, 1): `(1) > 1(1)^2 - 4` is true, and `(1) < (1) + 1` is true.
Neither inequality is or equal to so count only those integer points within the area and not on the line. The question asks for the number and there twelve of them (-1, -1), (-1, -2), (0, 0), (0, -1), (0, -2), (0, -3), (1, 1), (1, 0), (1, -1), (1, -2), (2, 2) and (2, 1).
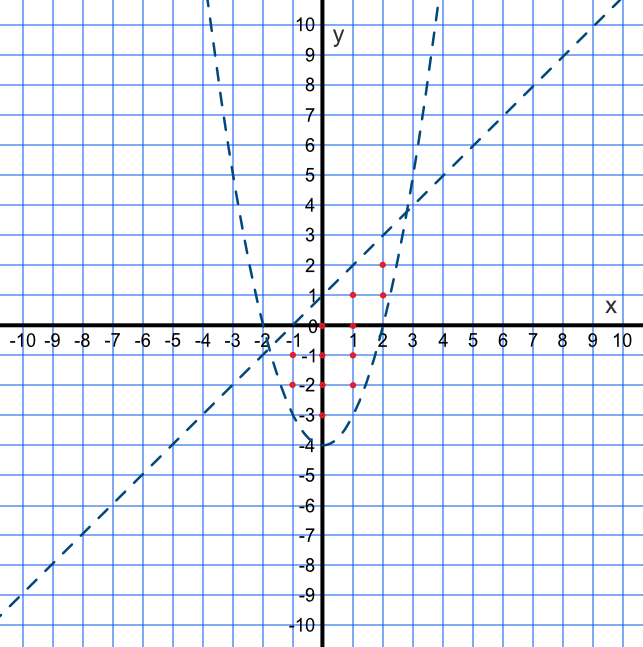
Answer: 12