Before plotting a graph, make sure that the equation has a single `y` on one side of the equals sign, and the `x` values are all on the other side. If the graph to be plotted is given as a function (`f(x)`), then it has already been correctly arranged.
Plot the graph as instructed in the question. For linear graphs, use a straight edge. For other graphs, draw a clear line keeping curves as regular as possible and passing through all the points.
If a sketch has been requested, show on the sketch the coordinates for the intercept with the `y`-axis, the roots of the equation (crossing the `x`-axis) and any turning points. A ruler must be used for the sketch - for the axis and any linear function.
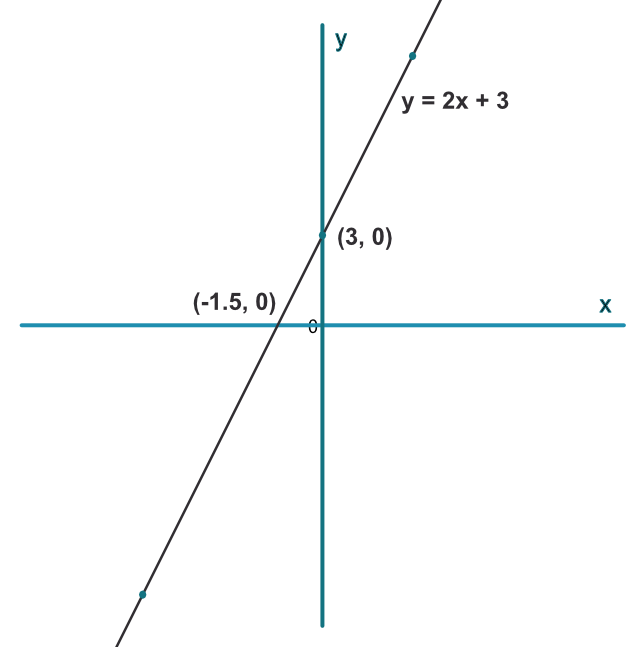
Sketch the graph for `y=2x+3`. Show the coordinates of the intercept points on the `x`-axis and the `y`-axis.
| `x` | -6 | 0 | 3 |
| `2x+3` |
Complete the table as indicated. Solve the equation for `y=2x+3` for the intercept on the `x`-axis.
2(-6) + 3 = -9
2(0) = 3 = 3
2(3) + 3 = 9
| `x` | -6 | 0 | 3 |
| `2x+3` | -9 | 3 | 9 |
Answer:
Complete the following table for the equation `4x^2=y + 6x - 2`
| `x` | -5 | -3 | -1 | 1 | 3 | 5 |
| ? | 132 | ? | 12 | ? | 20 | 72 |
Rearrange the equation `y+6x-2=4x^2`
`y+6x=4x^2+2`
`y=4x^2-6x+2`
And substitute for the two missing values
`y=4(-3)^2-6(-3)+2=56`
`y=4(1)^2-6(-1)+2=0`
Answer:
| `x` | -5 | -3 | -1 | 1 | 3 | 5 |
| `4x^2-6x+2` | 132 | 56 | 12 | 0 | 20 | 72 |
See also Plotting Graphs of Straight Lines and Quadratic Graphs