A Box Plot gives a visual presentation of the median and spread of a set of data. The Box Plot shows the Range, Inter-Quartile Range and the Mean.
It is also known as a Box and Whisker Diagram.
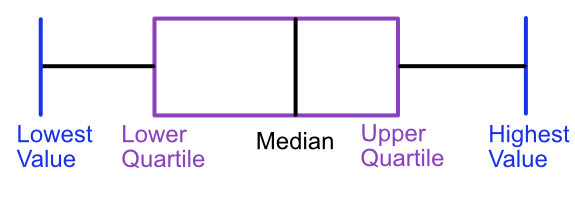
The diagram consists of 5 pieces of information. The Lowest Value is taken from the lowest value in the data set; similarly the Highest Value. The Median is the middle value when placed in order; the Lower Quartile is the `frac((n + 1))(4)`th value (reading from the lowest value) and the Upper Quartile is the `frac(3(n + 1))(4)`th value (also when reading from the lowest value).
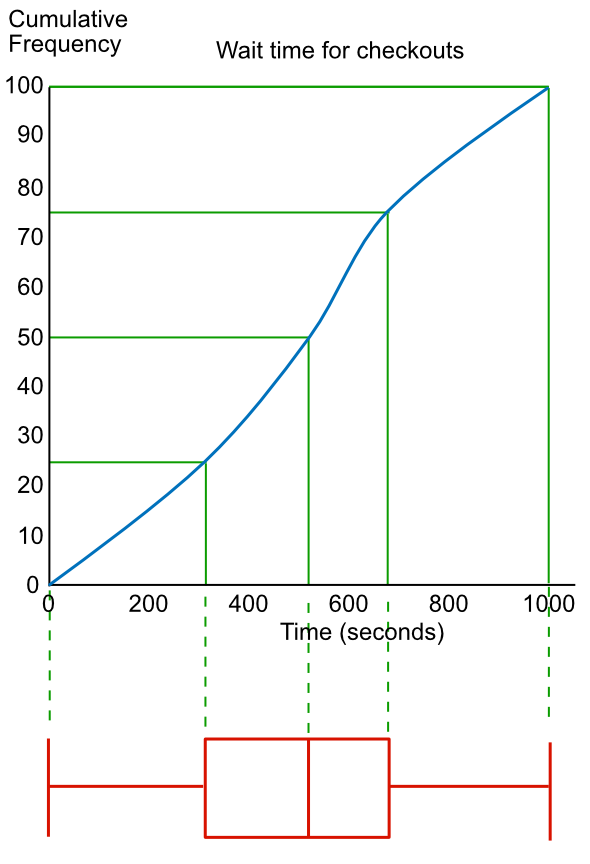
A Box plot can also be drawn from a Cumulative Frequency diagram.
Box Plots give more information on the spread of data, which is useful when comparing sets of data:
• a compact box, with long whiskers, shows the probable presence of outliers;
• a compact box, with short whiskers, shows a consistent set of data;
• an extended box, with long whiskers, shows a wide range of inconsistent data;
• an extended box, with short whiskers, shows a consistent set of data over a wide range.
Draw a Box plot for the following information, which is the speed of 27 cars through a radar trap in a 40mph zone:
34, 36, 37, 37, 33, 42, 44, 35, 46, 33, 38, 39, 40, 41, 20, 44, 38, 37, 42, 36, 41, 40, 40, 39, 40, 39, 39
Sort the data into order: a Stem-and-Leaf diagram could be used:
| 2 | 0 | ||||||||||||||
| 3 | 3 | 3 | 4 | 5 | 6 | 6 | 7 | 7 | 7 | 8 | 8 | 9 | 9 | 9 | 9 |
| 4 | 0 | 0 | 0 | 0 | 1 | 1 | 2 | 2 | 4 | 4 | 6 |
Key 2|0 represents 20mph
Lowest Value is 20
Highest Value is 46
Median Value is the 13th value, which is 39
Lower Quartile is `frac((27+1))(4)` = 7th car = 36
Upper Quartile is 3`frac(27+1)(4)` = 21st car = 41
Answer: 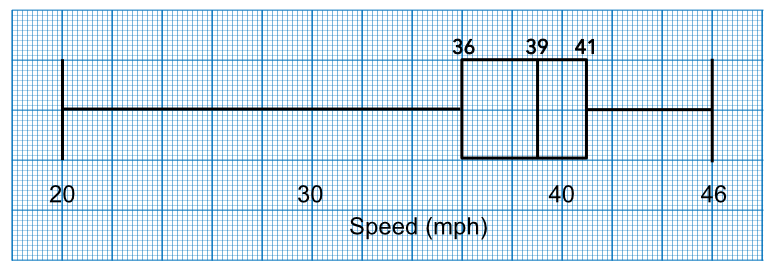
Two classes were each given a test paper. The information was shown on a box plot. Make two comparisons between the results from class A and the results from class B.

Use a comparison of both the average and the range.
Answer: Class B had a higher median score.
Class B also had a smaller interquartile range.