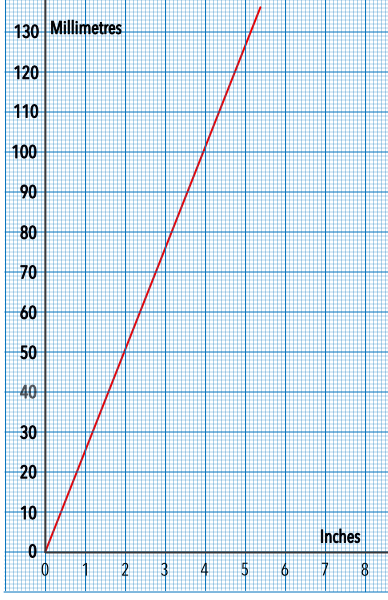
Conversion graphs show proportions between two quantities, such as measures changing metric to imperial, or foreign currency exchanges.
The important point to note is that these graphs will go through the point (0, 0).
Using the graph, below, convert 90mm to inches.
Draw a line from 90 millimetres to meet the graph. Drop down to obtain the inches value.
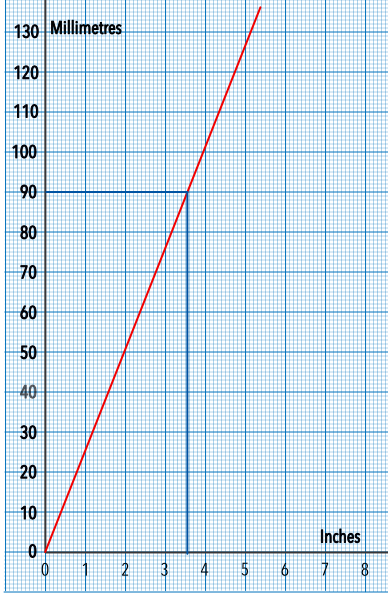
Answer: 3.5 inches
Give a reason why the graph, above, shows that the relationship between millimetres and inches is in direct proportion.
If the two measurements are in direct proportion, then when one value is zero the other value must also be zero.
Answer: The graph goes through the origin.
See also Converting Imperial and Metric and Foreign Currency