Proportions can be shown graphically. A direct proportion will be shown as a straight line, passing through the origin (0,0).
Drawing a graph allows the proportion of different values to be obtained. By reading one scale, the graph can be used to determine the other proportion value.
The exchange rate for Euros to British Pounds is €1 = £0.80. Draw a graph for the exchange rate for values from €0 to €180. Using the graph, determine the number of British Pounds that can be obtained for €140.
Plot the graph as shown.
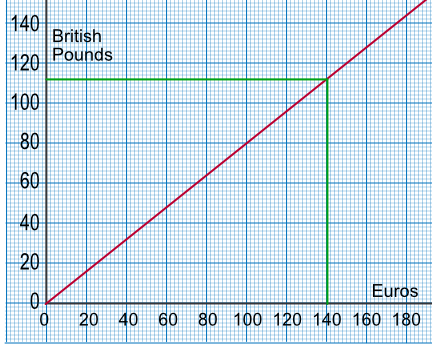
Then draw a line up from 140 Euros to meet the graph, then move along to read the amount in pounds from the vertical scale.
Answer: £112.00
Using the graph, above, how many Euros would I receive for £100?
Read along from £100 to meet the graph, then drop down to read the amount in Euros from the horizontal scale.
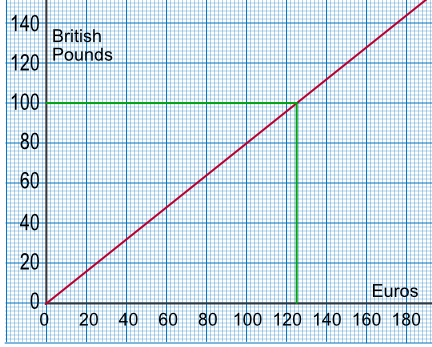
Answer: €125