A reciprocal function, such as `y = (1)(x)`, creates two curves on the graph in opposite quadrants. There are values on the graph which cannot be found: `x = 0` is a division by zero; and `y = 0` requires `x` to be equal to infinity. The values of `x = 0` and `y = 0` (in this example) are known as asymptotes: these are the lines that the curves tend towards, but never touch.
The function `y = 3 + frac(1)(x)` has been plotted on the graph below.
What are the asymptotes for this graph?
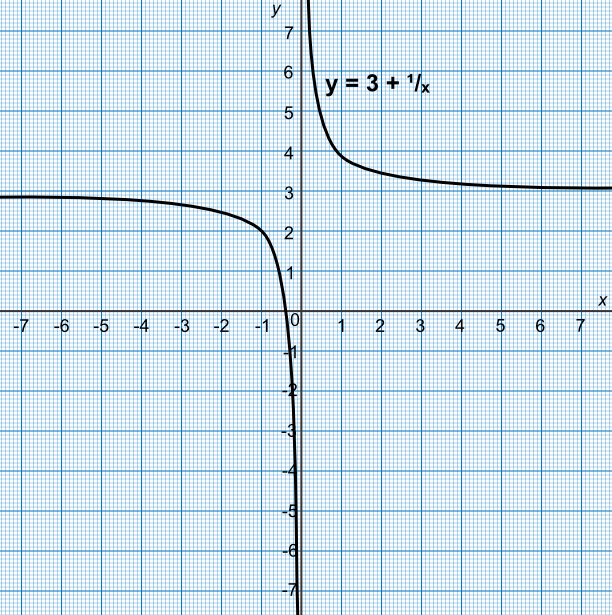
The value `y` = 3 requires `x` to be set to infinity.
The value `x` = 0 is a division by zero.
Answer: `x` = 0 and `y` = 3
Using the graph, above, estimate the value of `y` when `x` = -1.
Check the answer by substituting into the equation: `y = 3 +frac(1)(-1) = 2`.
Answer: 2
See also Reciprocals