Data can be grouped into class intervals. A survey of companies found the number of employees for each company was:
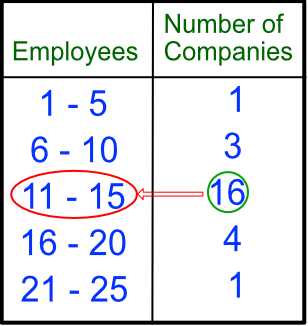
The Modal Class is the class with the highest frequency: in this case, the modal class is 11 - 15.
The median is the class that contains the middle member. Create a running count (cumulative frequency) and find the middle number. In this example there are 25 companies so the middle number is the 13th:
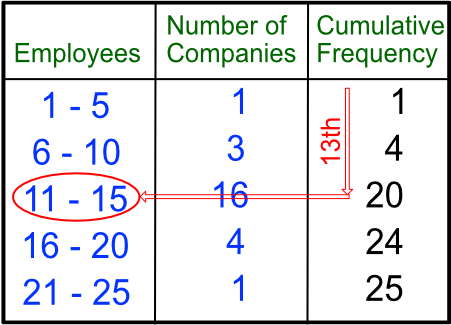
The 13th company is found in the class 11 - 15; this is the class interval of the median.
The Estimated Mean can be found by multiplying the midpoint of the class interval by the frequency. The mean is estimated because we are using the midpoint value rather than actual values:
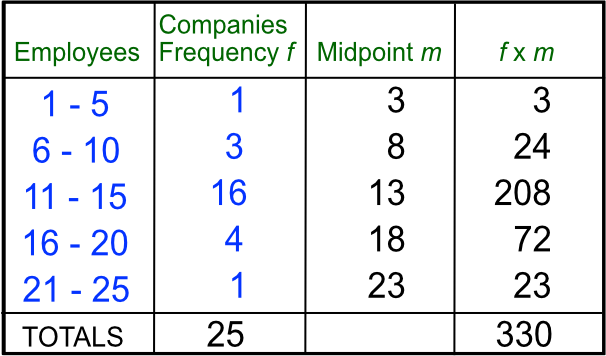
The estimated mean is 330 ÷ 25 = 13.2 employees.
The Range is the difference between the lowest possible value and the highest possible values: 25 - 1 = 24
A table may show class intervals with a simple range (e.g. 1 - 6) when the data is discrete; or as an inequality (e.g. 1 < x ≤ 6) when the data is continuous.
The information, below, shows how long employees took to travel to work. Give an estimated mean of the travel time to work.
| Travel Time (mins) | Employees |
|---|---|
| 0 < m ≤ 20 | 22 |
| 20 < m ≤ 40 | 15 |
| 40 < m ≤ 60 | 8 |
| 60 < m ≤ 80 | 2 |
From the table below, estimated total number of minutes for all employees = 1210. Number of employees = 27.
| Travel Time (mins) | Employees (e) | Midpoint (m) | m x e |
|---|---|---|---|
| 0 < m ≤ 20 | 22 | 10 | 220 |
| 20 < m ≤ 40 | 15 | 30 | 450 |
| 40 < m ≤ 60 | 8 | 50 | 400 |
| 60 < m ≤ 80 | 2 | 70 | 140 |
| TOTALS | 27 | 1210 |
Estimated mean = 1210 ÷ 27 = 44.81 minutes
Answer: 44.81 minutes
The table below shows the journey time for employees arriving at work for a company. What is the modal class?
| Travel Time (mins) | Employees |
|---|---|
| 0 < m ≤ 20 | 22 |
| 20 < m ≤ 40 | 15 |
| 40 < m ≤ 60 | 8 |
| 60 < m ≤ 80 | 2 |
The modal class is the class interval with the highest frequency (22).
Answer: 0 < m < 20