For histograms, the heights of the bars on a histogram indicate the frequency density. The area of each bar is the frequency. The Frequency Density changes for each bar on the histogram:
Frequency Density = `frac(text(frequency))(text(class width))`
Remembering the formula for the area of a rectangle, it might be easier to remember:
Frequency (the area) = Class Width x Frequency Density
and rearrange to suit the requirements.
A survey was made on the mileage covered by vans in a delivery fleet. The bottom scale shows thousands of miles. Using the histogram, determine how many vans completed between 10000 and 15000 miles.
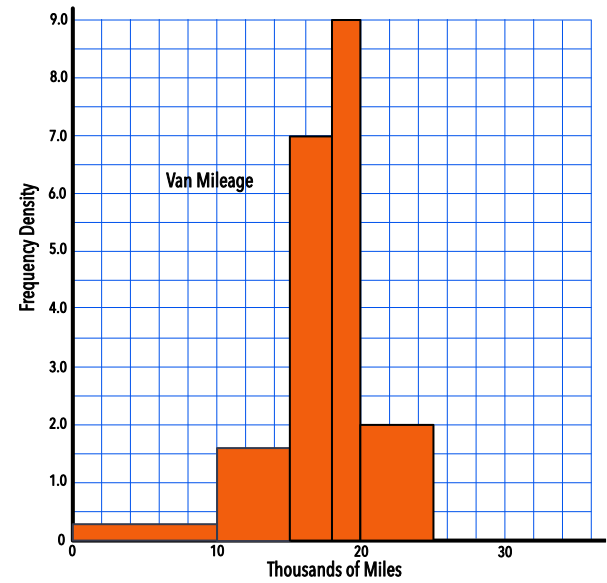
The class interval is 5.
The frequency density is 1.6.
Frequency = class interval x frequency density
5 x 1.6 = 8
Answer: 8
The value for mileage between 25000 and 32000 miles has not been plotted. If the number of vans was 7, and the scale is showing thousands of miles, what height should the bar be?
The number of vans is 7, and the class interval is 7.
Frequency density = `frac(text(frequency))(text(interval))` = `frac(7)(7)` = 1
Answer: 1