Scale diagrams often have both a scale and a grid. For example, a diagram might have a scale of 1:100, and if the grid is shown at 1cm intervals then 1cm represents 1m in real life.
The plan of the ground floor of a house is shown below. How long is the sitting room?
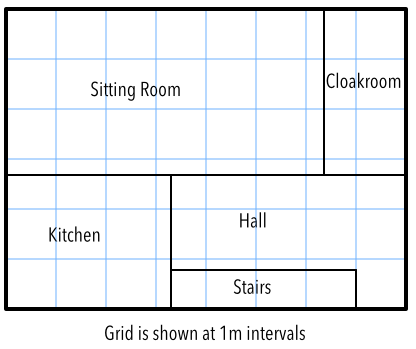
Measure along a grid line for 6.3 grid places.
Answer: 6.3m
The overall dimensions of the house are 8m by 6m. The plan is 16cm by 12cm. What is the scale of the plan?
Using the length to work out the scale.
16cm represents 8m.
Change both units to centimetres.
16 : 800
Dividing both sides by 16 gives 1 : 50.
Check width: 12 : 600 simplifies to 1 : 50 ✔
Answer: 1:50