Approximate solutions for simultaneous equations can be found by plotting a graph of the two functions and determining the point at which they cross. The coordinates of that point give the solution to the two equations:
• Arrange the equations so that both equations have the same unknown on one side;
• Plot both functions;
• Identify the crossing point of the functions;
• Check accuracy by substituting the values into the original equations.
The solutions are the intersection points. There may be no intersection points. For two linear functions, there can be zero or one intersection points. For linear/quadratic there may be none, one (the graphs touch) or, two (the graphs cross) intersection points.
Find an approximate solution to the simultaneous equations `2x+y=1` and `-x+2y=12` by plotting a graph.
Rearrange both equations:
`2x+y=1 -> y=1-2x` and
`-x+2y=12 -> y=0.5x+6`
Plot the graph
Obtain the intersection point for the solution (-2, 5)
Check:
2(-2)+5=1✔
-(-2)+2(5)=12✔
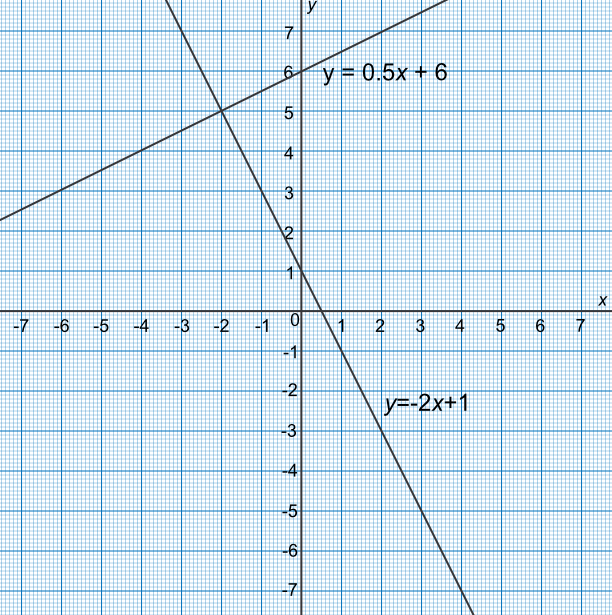
Answer: `x=-2` and `y=5`
Find an approximate solution, using a graph, to the simultaneous equations `y=x+2` and `y=x^2-4x+2`.
Draw both equations on the graph
Identify two intersection points at (0, 2) and (5, 7)
Solutions are `x=0, y=2` and `x=5, y=7`
Check:
(2) = (0) + 2✔
(7) = (5)2 - 4(5) + 2✔
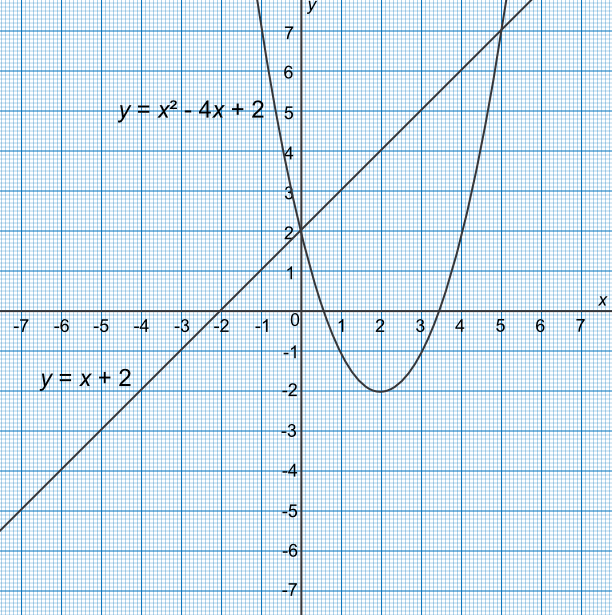
Answer: `x=0, y=2` and `x=5, y=7`
See also Plotting Graphs of Straight Lines