Graphs can be used to solve quadratic equations. Arrange the equation so that it is equal to zero on one side. Plot the graph as `y` against the function. The solutions can be found where the line crosses the `x`-axis.
Note that there may be 0, 1 or 2 solutions, depending on how many times the graph crosses the axis.
Note that the answer may only be approximate, depending on how accurately the graph is drawn.
Exam Tip: Substitute the values of `x` from the graph and substitute into the original equation to check the accuracy of the measurement.
By drawing a graph for -2 ≤ `x` ≤ 6, estimate the solutions to the equation `x^2 - 4x - 3 = 0` to one decimal place.
Plot the graph: coordinates are (-2, 9), (-1, 2), (0, -3), (1, -6), (2, -7), (3, -6), (4, -3), (5, 2), (6, 9)
Graph crosses the `x`-axis at 4.6 and -1.6.
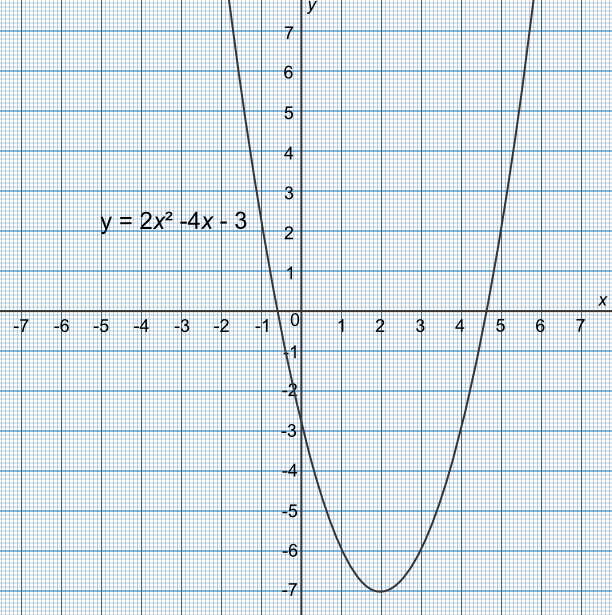
Check: `(4.6)^2 - 4(4.6) - 3 = -0.24`✔ `(-0.6)^2 - 4(-0.6) - 3 = -0.24`✔
Answer: `x=4.6 text( and ) x= -0.6`
By drawing a graph for 0 ≤ `x` ≤ 8, estimate the solutions to `x^2-8x=-16`.
Rearrange the equation to `0.5x^2-4x+8=0`, and plot the graph as `y=x^2-8x+16`.
Points to plot are (0,8), (1,4.5), (2,2), (3,0.5), (4,0), (5,0.5), (6,2), (7,4.5), (8,8)
Graph touches the `x`-axis at `x=4`. Note that there are two equal roots.
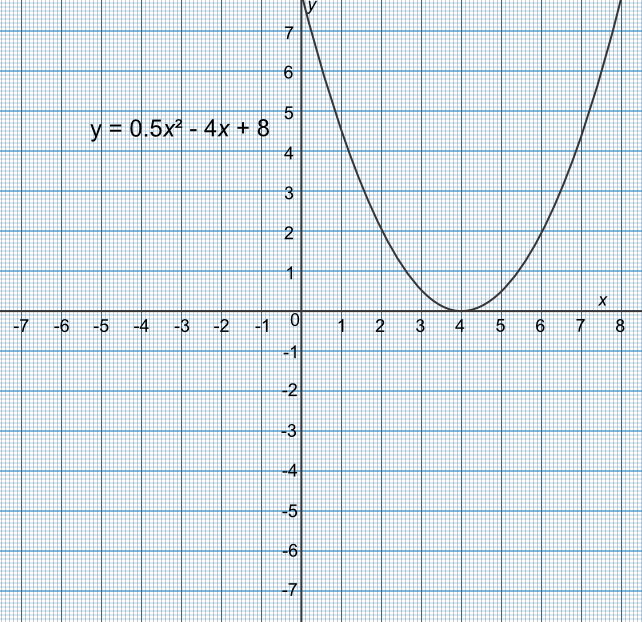
Check:
`0.5(4)^2 - 4(4) + 8 = 0`✔
Answer: `x=4` (both roots take the same value)