Inequalities can also involve two variables. As one variable changes, then the boundary of the inequality can change.
For example, in `y > x - 3`, an increase in the value of `x` will allow the valid set of values for `y` to change.
For linear inequalities, these can be represented graphically as sloping lines. A dotted line indicates that the values on the line are not included: and a solid line indicates that the values on the line are included.
After drawing an inequality on the graph, you should test points on both sides of the line to ensure that the correct side of the line, for the inequality, has been identified.
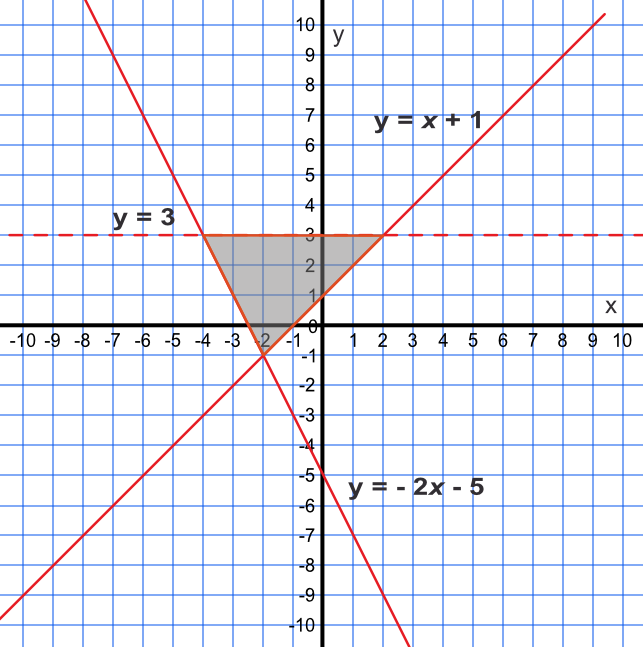
Show, by shading on a graph, the region satisfied by three inequalities: `y < 3, y ≥ -2x - 5 text( and ) y ≤ x + 1`
`y < 3`: the area below `y = 3` is the inequality; the line is dotted because it is less than.
`y ≥ -2x - 5`: consider the point (0, 5). Putting these values into the inequality gives 5 ≥ -2(0) - 5, which is true.
Therefore the area to the left and above the line satisfies the inequality. The line is solid as it is greater than or equal to
`y ≤ x - 1`: consider again the point (0, 5). Putting these values into the inequality gives 0 ≤ 5 - 1, which is true. The line to the left of the line satisfies the inequality. The line is solid as it is less than or equal to.
Answer:
List the integer coordinates satisfied by the following inequalities:
i) y > -4, ii) `y > -3x - 2`, iii) `y < 3x + 1`
Draw a graph of the inequalities to determine what values may be included. Determine, from the graph, those coordinates which are in the heavily shaded area. Note that points that fall on the dashed lines do not satisfy the inequalities.
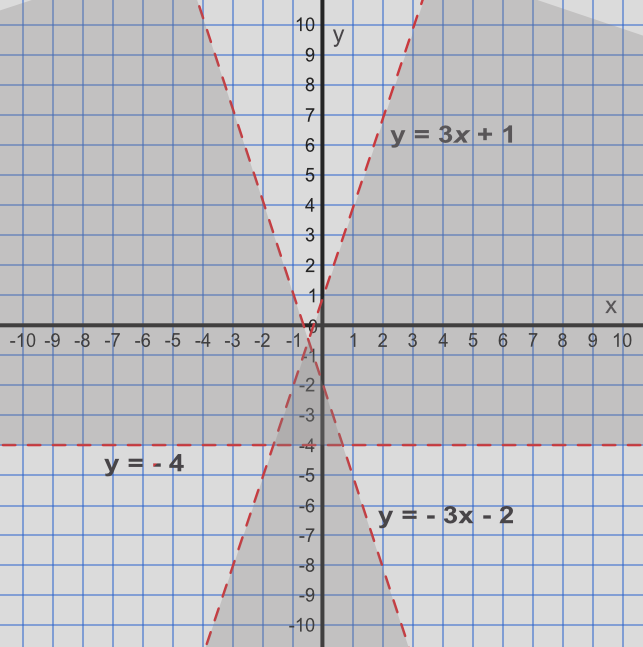
Answer: (0, -3) and (-1, -3)
See also Interpret Graphs of Linear Functions