A sketch of a function will show the `x` and `y` axes and a minimum amount of data, such as where the function cross the `x`- and `y`-axes. When more than one function is plotted on the same graph, the different functions must be identified. A scale does not need to be provided:
The equation of a linear function can be determined from a sketch by determining the gradient and intercept points.
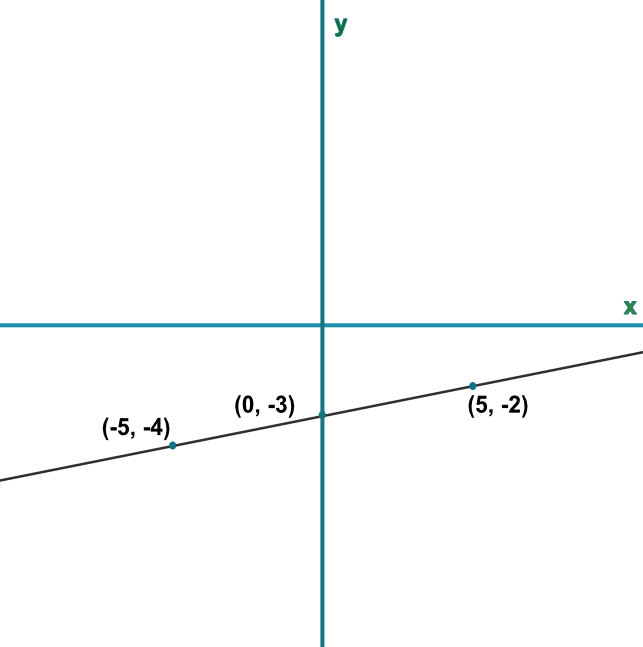
There is a piece of information missing from the sketch, below.
What is the missing information?
Sketches should contain axis, coordinates of crossing and turning points, and the equation of the line.
Answer: The equation, or function, of the line.
What is the value of the missing piece of information?
A linear function, so the form is `y=mx+c`
Find the gradient, `m`
From (0, -3), the gradient goes up 1 for 5 along = `frac(1)(5)` = 0.2
The intercept `c` is at (0, 03)
Substitute `m` and `c` into the equation for `y=0.2x-3`
Check using one of the coordinates -4 = 0.2(-5) - 3 ✔
Answer: `y=0.2x-3`