To plot a reciprocal graph, use several points. A reciprocal graph will have two lines, and both lines will be curved and tend toward the #asymptotes#. In real-life situations, only the positive part (above the x-axis) of the graph is shown. In algebraic usage, the negative part, which will be partially or totally below the y-axis, may also be shown.
Reciprocal graphs tend to show efficiency (fuel used against speed, the number of people allocated to a task against the time taken to complete it), or growth/decay (half-life of a radioactive sample).
A tree loses its leaves in inverse proportion to time: early in Autumn it loses many per day; later in Autumn it loses only a few per day.
The function can be modelled using: `frac(s)(d + 1)`, where s is the number of leaves on the tree at the start of Autumn and d is the number of days into the season.
Plot the graph for 20 days into the season, where the initial number of leaves was 18 000.
Answer:
| Day | 0 | 4 | 8 | 12 | 16 | 20 |
| Leaves | 18 000 | 3 600 | 2 000 | 1 384 | 1 058 | 857 |
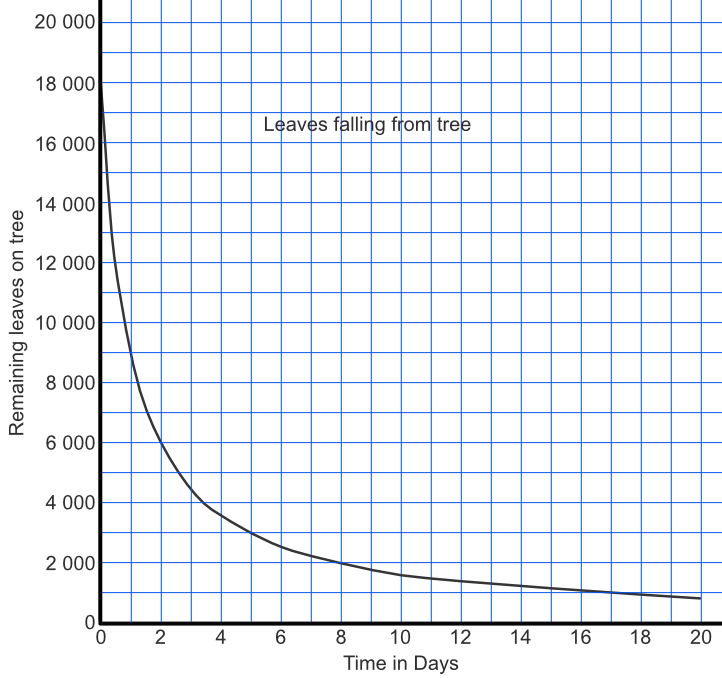
Using the graph in question 1, estimate how many days will elapse until there are only 5,000 leaves left on the tree.
Draw a line along from 5,000 to meet the curve, then read down to 2.6 days.
Answer: 2.6
See also Graphing Reciprocal Functions and Growth and Decay