The gradient on a graph gives the rate of change of one measure against another.
The steeper the gradient, the higher the value of the rate of change (increasing). If a gradient has a negative value, then the rate of change is negative (decreasing).
For example, a graph shows the cumulative number of widgets produced against the time in a shift. The gradient at any point on the line gives the rate of production for that time.
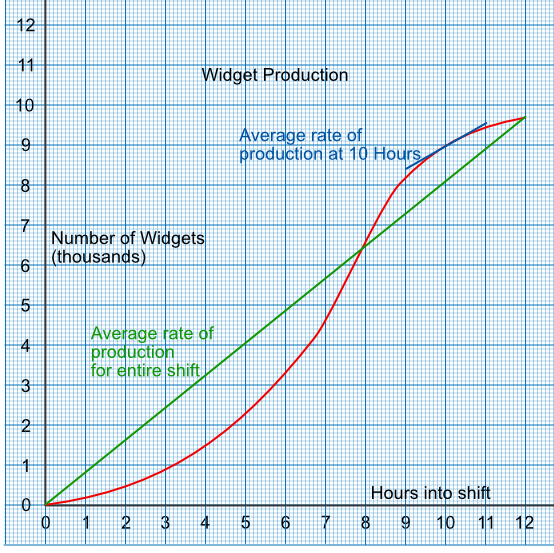
A line drawn from the start of the graph to the end gives the average gradient for that line. In this instance, this gives the average rate of production for the shift.
Using the graph, above, what is the rate of production 10 hours into the shift?
Note that the vertical scale is in thousands of widgets.
Draw a tangent to the graph at 10 hours
The gradient of the tangent is `frac(text(up))(text(along))`
= `frac(9550 - 8400)(11 - 9)`
= 550 widgets / hour
Answer: 550 widgets / hour
Using the graph, what is the average production for the 12 hour shift?
The gradient of the graph is given as `frac(text(up))(text(along))`
= `frac(9700 - 0)(12 - 0)`
= 808 widgets / hour
Answer: 808 widgets / hour
See also Estimate Gradients of Graphs