Graphs can be used to estimate solutions to equations.
The solution to the equation is given where the graph crosses the x-axis.
For some types of graphs, such as quadratics, there may be more than one solution if the line crosses the x-axis more than once. There may also be no solutions if the the line does not cross the x-axis at all.
When a solution is found, substitute back into the equation to check the answer.
In order to plot the graph correctly, you may have to re-arrange the equation as one side of the equation must equal zero.
The graph shows the function `2x + 3`. What is the solution to `2x + 3 = 0`?
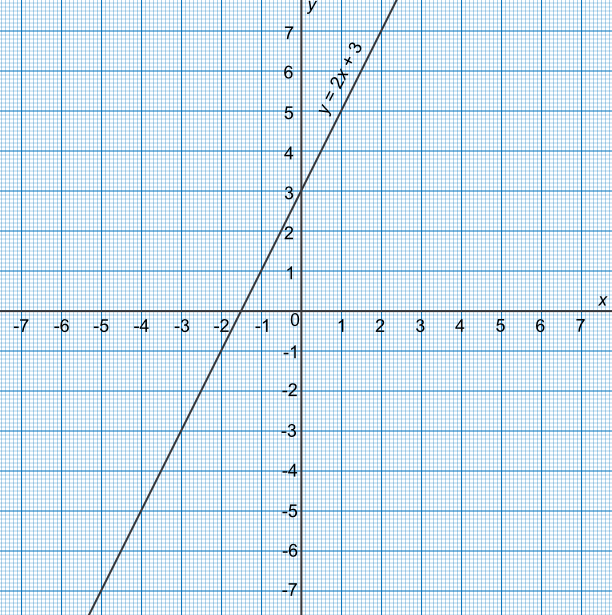
The line crosses the `x`-axis at - 1.5
Check the answer: 2(-1.5) + 3 = 0✔
Answer: `x = -1.5`
By drawing a graph, obtain the solution for `-2x + 10 = 3`.
It is necessary for one side of the equation to equal zero
Subtract 3 from both sides of the equation to get `-2x + 7 = 0`
Plot the graph using three points
The line crosses the `x`-axis at `x` = 3.5
Check the answer: -2(2.5) + 10 = 3✔
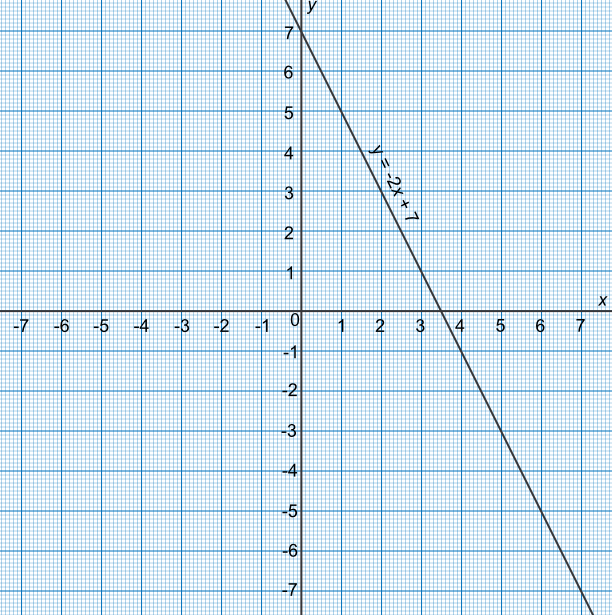
Answer: `x = 3.5`
See also y=mx+c and Equation of a Line