Inequalities can be represented on a graph. The inequality is shown by the line of the inequality, and a shaded area. The line of the inequality is shown in one of two ways:
• a solid line indicates that the line is included in the inequality: it is either ≤ or ≥;
• a dotted line indicates that the line is not included: it is either > or < .
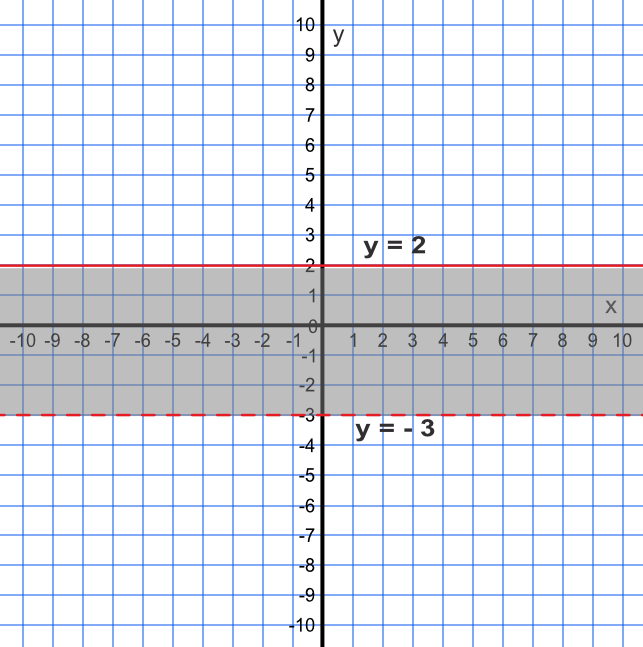
Shade, on a graph, the inequality described by `-3 < y ≤ 2`.
Note that the line y = 2 is a solid line (≤), and that y = -3 is a dotted line
Answer:
What inequality does the graph, represented by the shading and the line, describe?
Write the inequality using set notation.
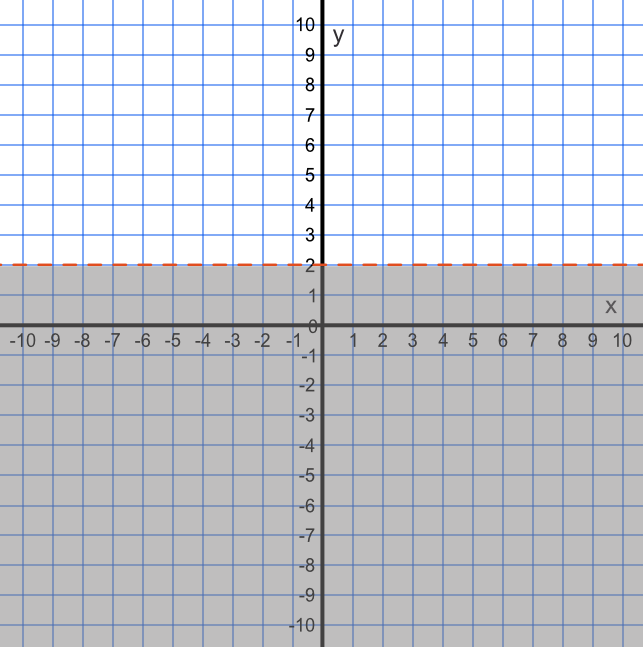
The shaded area is less than 2: because the line is dotted, the value of y = 2 is not included.
Answer: `{y: y < 2}`
See also Using Graphs to Solve Equations