Kinematics graphs deal with motion, and involve distance, time, speed and acceleration.
Time is shown along the bottom of the graph. Distance, speed or acceleration is shown on the vertical axis. Sometimes the distance is the total travelled; sometimes the distance is the distance from a fixed point: the description will make that clear.
For a time-distance graph, the gradient, or slope, of the line indicates the speed. The steeper the slope of the graph, the faster the speed. The slope between two points on a graph - even where the speed varies, gives the average speed. If the graph is horizontal, then the speed is zero.
For a time-velocity graph, the gradient gives the acceleration. If this type of graph is horizontal, then the acceleration is zero, in other words, the speed is constant.
A van is making drop-offs of goods at various locations. It starts from the depot at 9am, and drives to Warminster.
After unloading the van, it goes to Ashton where it arrives at 10.15. The driver unloads the van, has a break, then starts the return journey to the depot at 11am, arriving at 12pm.
From the graph, what is the average speed of the van, including the stop, between the depot and Ashton?
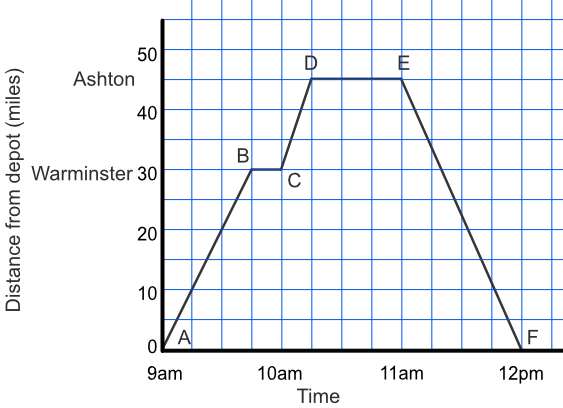
The distance is 45 miles. The time taken is 1.25 hours.
45 miles ÷ 1.25 hours = 36 miles per hour
Answer: 36 miles per hour, or 36mph
From the graph, above, how long was the van stopped at Warminster?
The vertical lines are 15 mins apart (there are 4 per hour).
The car is stopped for 1 interval.
Answer: 15 minutes
See also Estimate Gradients of Graphs and Estimate Areas under Graphs